


CS Cart Website SEO & Performance Optimization
Overview
Guaranteed 70 to 90 Google Pagespeed Improve speed of cs cart website
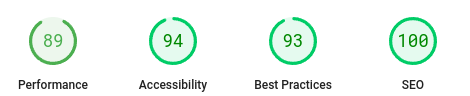
It will increase your CS Cart website Core Web Vitals metrics also it will appear at Google Pagespeed Insights Score along with before and after speed optimization scales, so you can see the progress.
will provide you with a free speed audit test. Periodically and keep a documented copy on the Google test link during the implementation period in a ticket on our CRM Shared Project..
all changes will be availalbe in customzied installed add-on not in CS-Cart Core.
Result score will be based on an average of 7 to 10 tests in Google Pagespeed Insights.
To get started, Please share your CS Cart Admin Panel and FTP Access.
Estimated time 21-30 business days
All steps are used accordingly
- Audit new speed test then document it before start
- Custom Add-on Developments
- Day by day check imporvments based on Google lighthouse core Engine with add-on updates
- When the maximum possible implementation is reached, the service is delivered in the form of a final report, and the progress difference is compared with the initial report.
- The service will be applied in a concentrated manner on the home page
- The services are also applied on some internal pages such as the section and product page
Technologies used
- Programming Language: PHP
- Addon Installation: Yes
- PHP Framework: No Framework
- JavaScript Interface: Yes
- JavaScript Framework: No Framework
- CSS Used: Yes
- CSS Framework: No Framework
- Database Used: No
Core Web Vitals metrics
Core Web Vitals are a set of field metrics that measure important aspects of real-world user experience on the web. Core Web Vitals includes metrics, as well as target thresholds for each metric, which help developers qualitatively understand whether the experience of their site is "good", "needs improvement", or is "poor". This post will explain the approach used to choose thresholds for Core Web Vitals metrics generally, as well as how the thresholds for each specific Core Web Vitals metric were chosen.
Refresher: Core Web Vitals metrics and thresholds In 2020 the Core Web Vitals are three metrics: Largest Contentful Paint (LCP), First Input Delay (FID), and Cumulative Layout Shift (CLS). Each metric measures a different aspect of user experience: LCP measures perceived load speed and marks the point in the page load timeline when the page's main content has likely loaded; FID measures responsiveness and quantifies the experience users feel when trying to first interact with the page; and CLS measures visual stability and quantifies the amount of unexpected layout shift of visible page content.
Each Core Web Vitals metric has associated thresholds, which categorize performance as either "good", "needs improvement", or "poor":
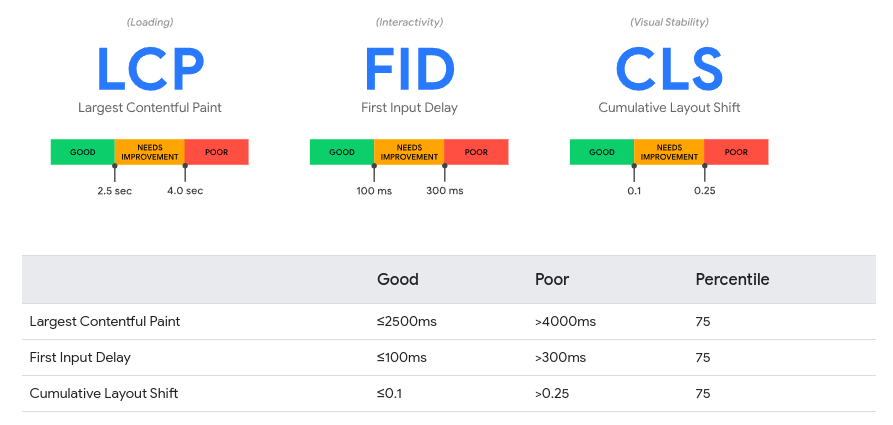
Target Score
Largest Contentful Paint (LCP)
Largest Contentful Paint (LCP) is one of the three Core Web Vitals metrics, and it represents how quickly the main content of a web page is loaded. Specifically, LCP measures the time from when the user initiates loading the page until the largest image or text block is rendered within the viewport.
What is a good LCP score? To provide a good user experience, sites should strive to have Largest Contentful Paint of 2.5 seconds or less. To ensure you're hitting this target for most of your users, a good threshold to measure is the 75th percentile of page loads, segmented across mobile and desktop devices.
Interaction to Next Paint (INP)
INP is a metric that assesses a page's overall responsiveness to user interactions by observing the latency of all click, tap, and keyboard interactions that occur throughout the lifespan of a user's visit to a page. The final INP value is the longest interaction observed, ignoring outliers.
Cumulative Layout Shift (CLS)
Unexpected movement of page content usually happens when resources load asynchronously or DOM elements are dynamically added to the page before existing content. The cause of layout shifts might be images or videos with unknown dimensions, fonts that render larger or smaller than its initial fallback, or third-party ads or widgets that dynamically resize themselves.
Differences between how a site functions in development and how its users experience it make this problem worse.
- Personalized or third-party content often behaves differently in development and in production.
- Test images are often already in the developer's browser cache, but take longer to load for the end user.
- API calls that run locally are often so fast that unnoticeable delays in development can become substantial in production.
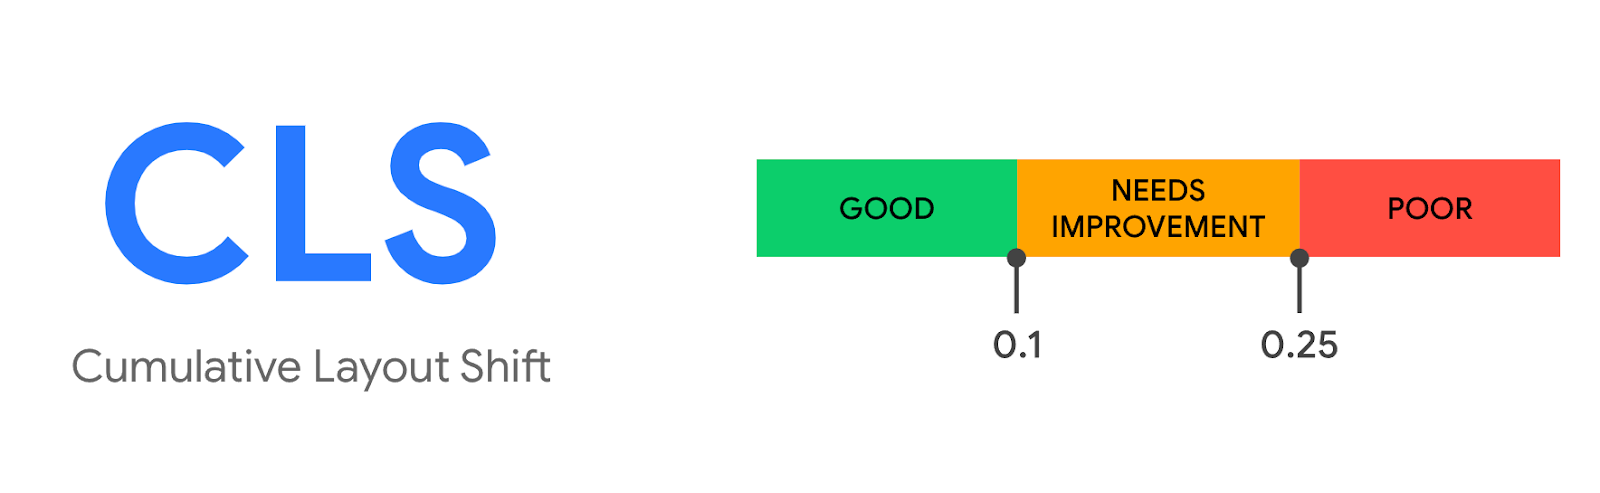
The Cumulative Layout Shift (CLS) metric helps you address this problem by measuring how often it's occurring for real users.
What is a good CLS score? To provide a good user experience, sites should strive to have a CLS score of 0.1 or less.
First Contentful Paint (FCP)
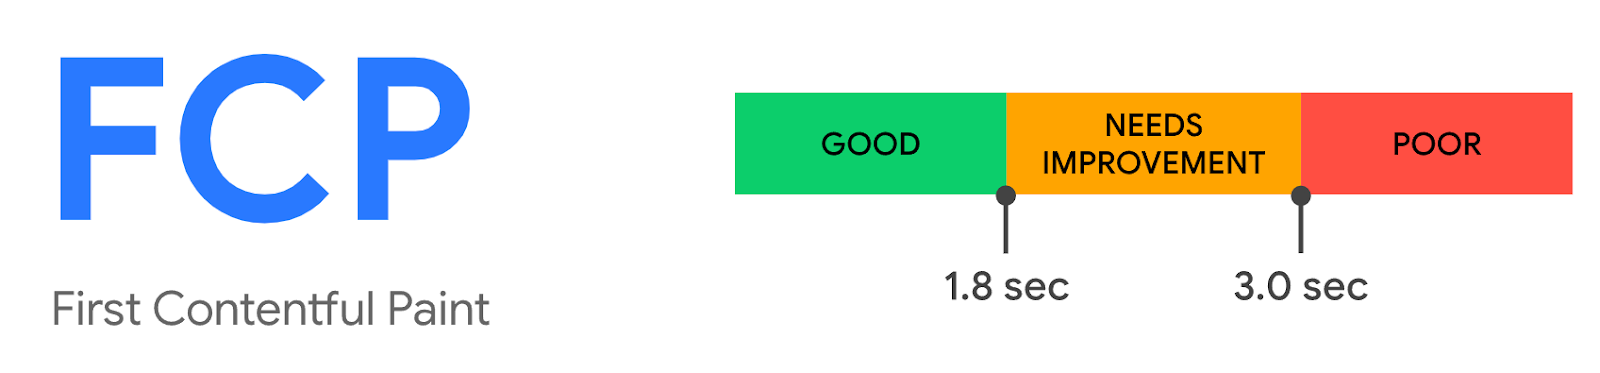
First Contentful Paint (FCP) measures the time from when the user first navigated to the page to when any part of the page's content is rendered on the screen.
What is a good FCP score? To provide a good user experience, sites should strive to have a First Contentful Paint of 1.8 seconds or less.
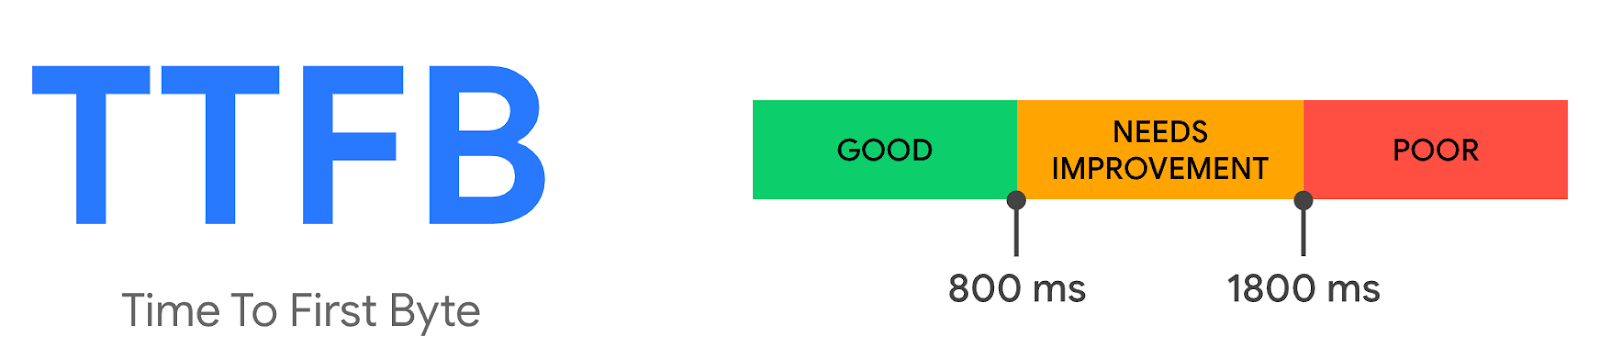
Time to First Byte (TTFB)
TTFB is a metric that measures the time between the request for a resource and when the first byte of a response begins to arrive.
- Redirect time
- Service worker startup time (if applicable)
- DNS lookup
- Connection and TLS negotiation
- Request, up until the point at which the first byte of the response has arrived
Reducing latency in connection setup time and on the backend can lower your TTFB.
What is a good TTFB score? Most sites should strive to have a TTFB of 0.8 seconds or less.
Why your score fluctuates
A lot of the variability in your overall Performance score and metric values is not due to Lighthouse.
- A/B tests or changes in ads being served
- Internet traffic routing changes
- Testing on different devices
- Browser extensions that inject JavaScript and add/modify network requests
- Antivirus software
Note: This service is provided for the first time only, and a mini-service can be provided to update the standards periodically.
Diagnose Lighthouse performance scoring
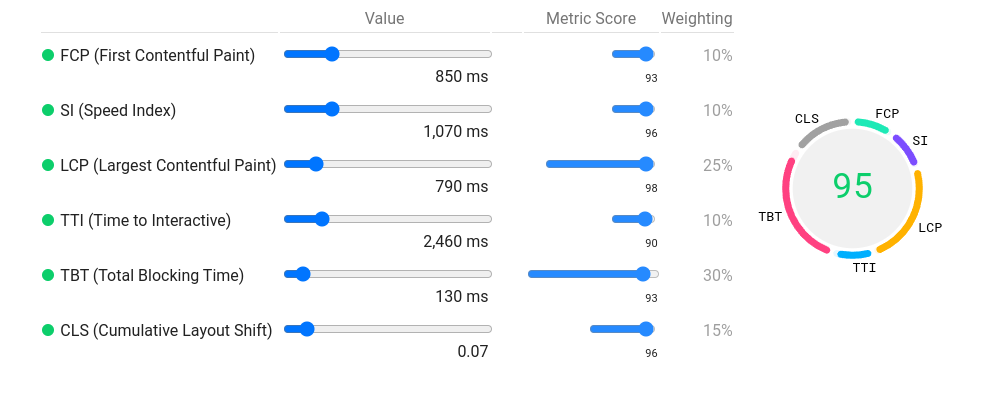
How Lighthouse calculates your overall Performance score
In general, only metrics contribute to your Lighthouse Performance score, not the results of Opportunities or Diagnostics.
Before

After
No reviews found